I’ve recently been working on reverse-engineering the parser and game code of an Infocom interactive fiction game. In future posts, I will write more about the findings and the process. In this post, I am going to focus on a really nice tool for debugging z-machine code that I have found and am working to extend.
While the workings of Infocom’s virtual z-machine is really well known thanks to the work of Graham Nelson and others, no source code is available for the Infocom games. There is a drive with a copy of Infocom’s server out there, but not available for now, so the only way to find out how exactly Infocom was using the z-machine’s capabilities is to go in and reverse engineer it.
One of the tools that I am using is ZDebug by Dustin Campbell, a Microsoft employee and member of the C# team (short preview: the code is really nice C# and WPF). It seems like the bulk of the work was done in 2011 on the project.
What it can do
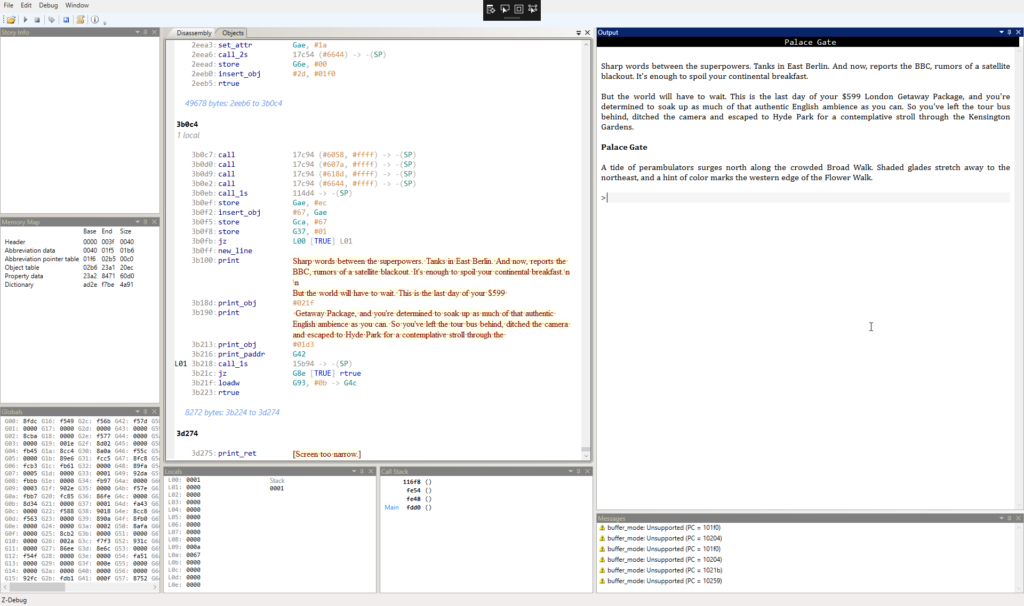
zDebug is set up with a window for executing a z-machine game on the right side. It comes with a full implementation of the machine, so you can just use it to play games. But apart from this, it also features
- a disassembly view: This allows you to see the opcodes and arguments of each line of disassembled code
- breakpoints
- stack traces
- local and global variable values, including highlighting of changed values
- object tables
The features included are already awesome as they are and helped me a lot with finding out new things and confirming theories.
What I did so far
So far, I’ve made three changes to the source code in my fork. The first one was more of an inconvenience: When the program starts, it saves the width of the game view in characters. Some games check this value and complain if it is not large enough. But, even if you enlarged the window at a later point, still the initial value was used, so I hooked up a listener for resize events to update this value (probably not something Infocom engineers envisioned happening – a dynamically resizing display…)
The first larger change came after I compared the disassembly of zDebug with that of TXD, a disassembler that outputs to text files. One of the big advantages of TXD is that it creates labels for jumps inside functions. This really helps with reading functions, so I set up zDebug to create labels and show them where appropriate.
The latest change is creating support for data breakpoints, i.e. a breakpoint that is triggered when a region in memory changes. At this point, it is pretty versatile, so I just tell the system to what address and how many bytes to watch. This can then be used to watch pretty much everything, including global and local variables and probably also the object tree. The next step on this is going to be creating UI elements to set data breakpoints.
Future work
In general, I will let my hacking be guided by my needs for more information. For more compatibility with TXD, it would be nice to use the method of TXD for finding all routines in a game at load time and then assign the same names to functions as TXD does, which would help with combining both tools. At the moment, zDebug parses a subset of all functions and then adds new ones it does not know about once they have been called or referred to in another function at runtime.
Other convenience features would include different visualizations, for example to be able to visualize the memory at a certain address in memory as a string, an array of values, … At the moment, for example when you know that a global variable saves the address of a string, you have to look up the string manually. Instead, you could tell zDebug to show you the value as interpreted as a string.
See the results
You can find my fork of the project at https://github.com/SpookyFM/ZDebug.
The original repo by Dustin Campbell is over at https://github.com/DustinCampbell/ZDebug